Hello Reader,
Indian Equity markets have been undergoing correction everyday over the last one month.
Nifty down 37% from its 52 week high of 12,430.5 to the lows of 7,832.55 on 19/03/2020 due to headwinds from the COVID-19 outbreak.
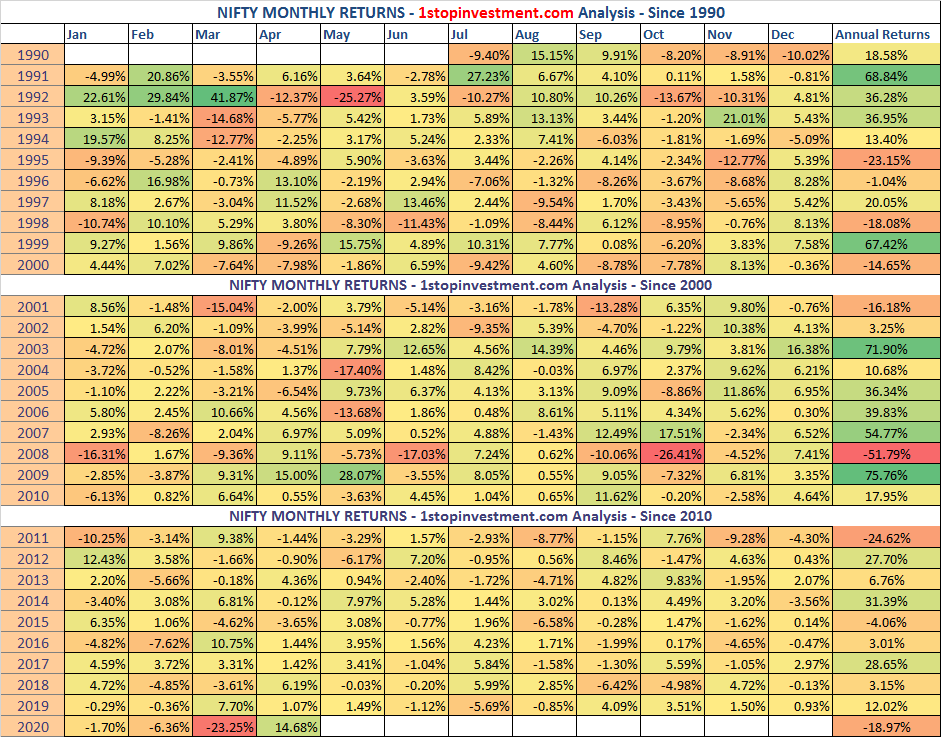
Each day Indian market has hit new lows. To ease the readers with each year data, 1stopinvestment has collected past year datas & summarised the below table.

Nifty closing levels and the above data is taken from NSE Website.
What is drawdown ?
“A drawdown is a peak-to-trough decline during a specific period for an investment”
For Example, in 2020, from the peak 12430.5 , it slided to 7832.5 almost 4598 points. This is 4598/12430 = 37% Drawdown.
“Drawdowns are a measure of downside volatility.”
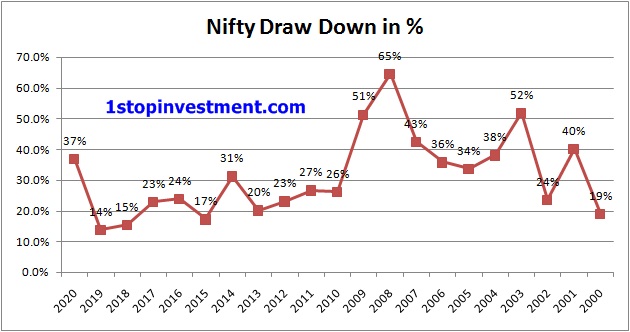
Nify – yearwise drawdown :
Check out our daily report here to see the Market today’s closing levels.


Pingback: Covid-19 Impact | Nifty Halts trading and hits New low - 23 March 2020