Quarterly financial statements help an investor understand the direction in which a company’s business is moving and insight to company’s financial health.
As a beginner investor, some of you may be wondering why companies publish their quarterly financial statements apart from their annual reports. Of course, it is mandated by SEBI, as per listing agreements with the stock exchanges, all listed companies must disclose their quarterly financial results within 45 days from the end of the quarter in a specified format.
Annual reports and Quarterly reports give investors a clear view about the company financial status. Annual reports measure the consistency and direction of the company performance while Quarterly reports gives a glimpse about its capacity to achieve what they said in their annual report.
Quarterly earnings report can help to analyze whether the stock is worth investing or not.
Are you looking for any below ?
Quarterly Earnings Season:
Generally, Earnings from different listed companies announce their results in the below period.
- From April 3rd Week to End of May – Annual Report & Q4
- June 3rd Week to 2nd week of August – Q1 Report
- October 3rd Week to End of November – Q2 Report
- January 2nd Week to End of February – Q3 Report
Let us look into some of the important parameters that Investors need to see at the report and what they mean.
1. Sales Numbers / Revenue / Income
Two types of sales figures are reported in the quarterly financial report.
- Net Sales
- Gross Sales – (Also, referred as Top line / Total Sales)
First, Compare the numbers with Quarter on Quarter (QoQ) & Year on Year (YoY).
Then Compare with the Sector Peers.
Net Sales are calculated by (Gross Sales) minus (Sales return + Sales Allowance + Discounts) from the Operations.
Increase in Gross Sales Numbers YoY and QoQ indicates the Growth in Business. For the already invested shareholder, this is key number which they look forward to take their decision whether to increase or decrease their stakes.
In Auto sector every month the sales numbers will makes a impact in their share price with the expectation from the streets. LIkewise, Increase in numbers indicates growth in business.
2.Operating profit
From the Net Sales, Deduct all the operating expenses. It gives the Operating Profit.
Operating expenses includes Purchase of raw materials, Employees Cost ,R&D Expenses, Rental Charges, office supplies , Utilities bills, etc.
Operating profits are also known as EBITDA (Earnings before Interest, Tax, Depreciation and Amortization) and Operating performance Indicator of the Company.
EBITDA shows the business conditions and how management is running the business.
Any Unexpected Increase in Operating expenses will lead to fall in business.
3.Profit after tax (PAT)
It is the bottom line, where Gross Sales is Top line.
PAT is calculated by deducting all the expenses like Interest on loans, depreciation and amortization on assets and tax.
Rise in PAT indicates a Positive sign for the company
4.Earnings per share (EPS)
EPS or Earning per share is the Net earnings of the company earning on One Share.
Basic EPS is calculated by (PAT – Dividends) divided by (Number of Outstanding Shares).
Increase in EPS on QoQ and YoY is a good indicator that Company is running a profitable business.
5.Interest expenses
It is the total sum of the interest paid on different loans taken by the company.
If there is Increase in Interest expenses, then the company has increased its debt which is not good for the company. However, Increase in Sales and Increase in debt which shows that the company may have increased the working capital loans. They might have gone for Expansion in the business by availing loans.
6.Shareholding Pattern
Along with other above numbers, Companies will disclose their ownership across various investors groups like FIIs, Mutual funds and Promotor holdings.
What to look for in the shareholding pattern.
- Increase in Promotor holding percentage is considered positive sign for the company as the owner have confidence in company future earnings.
- Promotor Pledged Shares proportion. If there is increase in Pledging , shall be considered as an alarming situation for the investors.
- Mutual Funds Portfolio – If many AMCs bought the stocks, It is a good sign.
Sequential Comparison Way
One way of comparison is to relate the quarterly performance meaning which quarter-on-quarter (QoQ) basis and Another one is based on year-on-year (YoY).
QoQ is a comparison of a quarter just prior to the current quarter. For instance, a comparison of the quarter ended March 2020 with the quarter ended December 2019. QoQ gives the company’s ability to achieve its Projection estimated in the YoY report.
YoY is a comparison of a current year report with previous year. For example, a comparison of the quarter ended March 2020 with the year ended March 2019. Compare 5 years values to understand the company progress. If there is a steady increase, then this is positive sign for the company.
Compare with sector peers to understand the trend of the financial statements.
A Sample Report – TCS Analysis
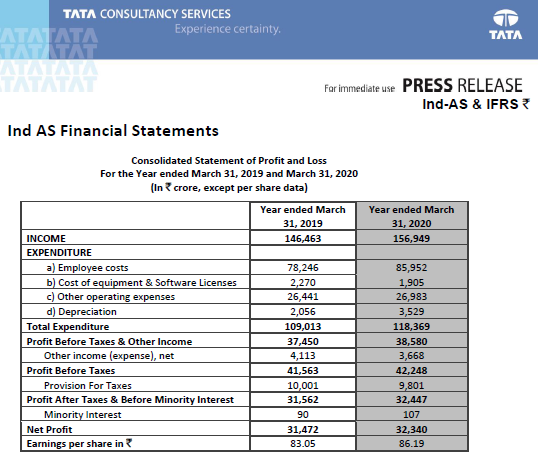
Source : TCS Press Release
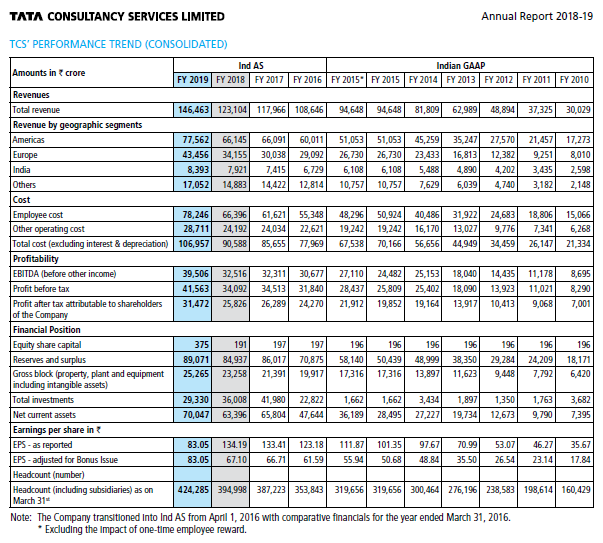
Annual report of 2018-19 is also attached for more reference.
♠ Total Revenue Check :
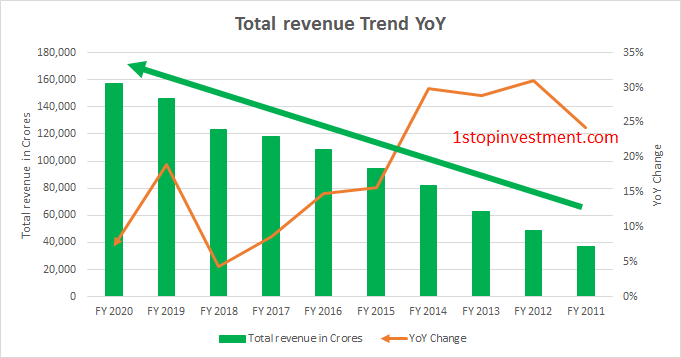
As you see from the graph, Year on Year the revenue keeps increasing. This is Positive for the Company.
But % of YoY Change is 7% where as in the previous year it was 19% Growth. This is one thing investor should know.
♠ Total Operating Expenses Check :
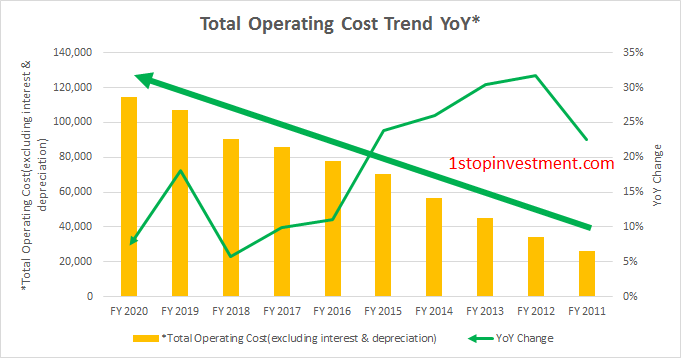
As the Revenue Increases , Expenses also Increasing. So there will be impact in the Company’s Profit.
How do we know that company net growth. By splitting further the analysis, Compare the Revenue and Expense YoY Change.
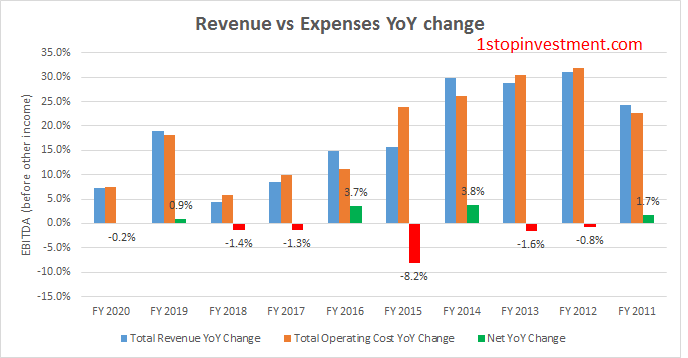
The above chart shows you a clear Picture of the Net Change in YoY. So there is no unusual jump and it is Neutral Sign for the Company.
Also, the Company has paid a hefty dividend to the shareholders. 73Rs per share comparing 30rs per share.
♠ PAT Comparision:
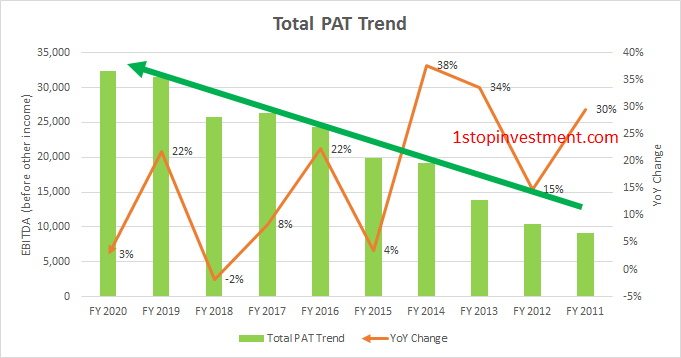
Profit after tax show the saturation in this year. 3% Growth in the Profit which investors are worried because they have see 22% previous year.
♠ EPS Comparision:
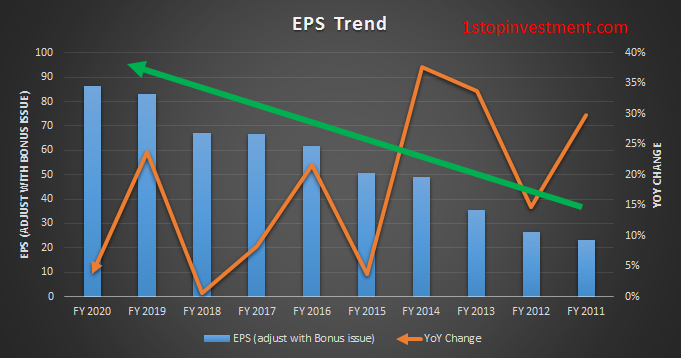
As far as the EPS is rising, It is a Positive sign for the company.
So by far seeing the report analysis, Investors have nothing to worry about their stake in the company.
Other things available in the report
- Board of Directors list
- REMUNERATION OF DIRECTORS AND Other KEY PERSONs
- Company Products list
- Revenue by Geographic locations
- Funds invested portfolio
- Ratio Analysis
- Tax Paid
- Dividend Information
Due to Corporate Tax cut, You can see the Tax paid by the Companies are lesser compared to the previous year.
Trade with Earnings
There are many traders who jump in the Earning season and trade with the trends. The share price of the company is undoubtedly leads to huge swing based on the result numbers.
Already there will be a street estimates for the company. The stock price doesn’t swing based on the actual numbers but only based on How well it beats the street estimates.
If the dalal street is expecting a loss and actual loss is lower than expected, then the stock price can actually move up. On the other hand, even if the company gives profit but less than the market expectation, stock price unfavorably reacts to it.
So it is always better to stay in Sidelines during this period and When you are uncertain about the direction, why to trade for short term gains.
Conclusion
Investors should not look only at the Profit (Sales numbers) meanwhile there are other things also in the report like, Debts , Interest payoff and Profit margin.
Hope the above articles helps in reading the financial statements of the company.
Let us know in the comments what other things you will see in the report.
Happy Investing!


Very nice article for new comers siva
Thanks bro ! Do share with the new comers you know !